A Basic Tutorial for the Language
This chapter presents a basic overview of the language. The goal is to present a quick guide using examples for the user to get started. In addition, some key concepts necessary to understand and use the language are explored.
A sample FPL code block:
function example() {
    search {from="-8h"} sContent("@tags","fpl-example-data")
    let {id, isx5, isprime, odd, even, divisors} = f("@fields")
    aggregate v=values(id) by divisors
    let num_of_ints = listcount(v)
}

stream demo_table=example()
Please visit the relevant chapter(s) or section(s) for detailed information on a particular subject or command of the Fluency Processing Language.
Demo Dataset
For the most part, FPL taps into the same data source as the main search/processing functions of Fluency. For more information on data ingress, visit the Data Selection sections.
Consider the following example dataset of twenty (20) JSON records:
Original data
{"id":1,"isx2":"no","isx5":"no","isprime":"no","isnum":"yes","numstr":"1","odd":true,"divisors":1}
{"id":2,"isx2":"yes","isx5":"no","isprime":"yes","isnum":"yes","numstr":"2","even":true,"divisors":2}
{"id":3,"isx2":"no","isx5":"no","isprime":"yes","isnum":"yes","numstr":"3","odd":true,"divisors":2}
{"id":4,"isx2":"yes","isx5":"no","isprime":"no","isnum":"yes","numstr":"4","even":true,"divisors":3}
{"id":5,"isx2":"no","isx5":"yes","isprime":"yes","isnum":"yes","numstr":"5","odd":true,"divisors":2}
{"id":6,"isx2":"yes","isx5":"no","isprime":"no","isnum":"yes","numstr":"6","even":true,"divisors":4}
{"id":7,"isx2":"no","isx5":"no","isprime":"yes","isnum":"yes","numstr":"7","odd":true,"divisors":2}
{"id":8,"isx2":"yes","isx5":"no","isprime":"no","isnum":"yes","numstr":"8","even":true,"divisors":4}
{"id":9,"isx2":"no","isx5":"no","isprime":"no","isnum":"yes","numstr":"9","odd":true,"divisors":3}
{"id":10,"isx2":"yes","isx5":"yes","isprime":"no","isnum":"yes","numstr":"10","even":true,"divisors":4}
{"id":11,"isx2":"no","isx5":"no","isprime":"yes","isnum":"yes","numstr":"11","odd":true,"divisors":2}
{"id":12,"isx2":"yes","isx5":"no","isprime":"no","isnum":"yes","numstr":"12","even":true,"divisors":6}
{"id":13,"isx2":"no","isx5":"no","isprime":"yes","isnum":"yes","numstr":"13","odd":true,"divisors":2}
{"id":14,"isx2":"yes","isx5":"no","isprime":"no","isnum":"yes","numstr":"14","even":true,"divisors":4}
{"id":15,"isx2":"no","isx5":"yes","isprime":"no","isnum":"yes","numstr":"15","odd":true,"divisors":4}
{"id":16,"isx2":"yes","isx5":"no","isprime":"no","isnum":"yes","numstr":"16","even":true,"divisors":5}
{"id":17,"isx2":"no","isx5":"no","isprime":"yes","isnum":"yes","numstr":"17","odd":true,"divisors":2}
{"id":18,"isx2":"yes","isx5":"no","isprime":"no","isnum":"yes","numstr":"18","even":true,"divisors":6}
{"id":19,"isx2":"no","isx5":"no","isprime":"yes","isnum":"yes","numstr":"19","odd":true,"divisors":2}
{"id":20,"isx2":"yes","isx5":"yes","isprime":"no","isnum":"yes","numstr":"20","even":true,"divisors":6}
Parsed data
When an entry from the dataset above is loaded into (for instance, via Syslog) and parsed by Fluency, we have the following JSON record (Note that the content of the original message (@message) has been parsed in the @fields object):
{
  "@message": "",
  "@facility": "kern",
  "@level": "notice",
  "@tags": [
    "fpl-example-data"
  ],
  "@source": "log-generator",
  "@sender": "1.2.3.4",
  "@timestamp": 1662053991000,
  "@fields": {
    "isnum": "yes",
    "numstr": "13",
    "isx2": "no",
    "isx5": "no",
    "divisors": 2,
    "id": 13,
    "isprime": "yes",
    "odd": true
  },
  "@type": "event"
}
The following example will make use of this parsed dataset. It is assumed that all 20 records are loaded into Fluency, and that no other data objects are currently present in the system.
Note: This simple demo dataset, and other similar datasets, may be referenced in several other places throughout the manual to illustrate certain concepts.
A Simple FPL Task
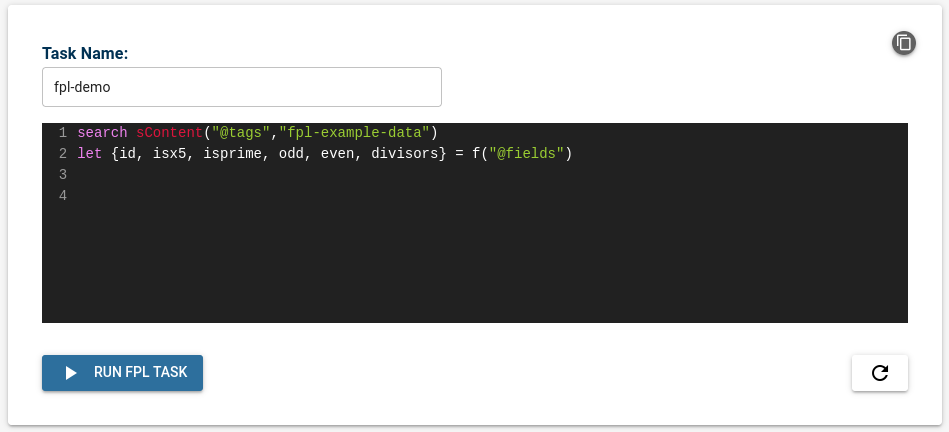
On the Fluency interface, the FPL Task Editor is used to generate FPL tasks.

Consider the following basic FPL task:
search sContent("@tags","fpl-example-data")
let {id, isx5, isprime, odd, even, divisors} = f("@fields")
Within FPL, a 'task' is comprised of one or more 'stream' blocks, which are themselves collections of 'pipes', each on a separate line.
A 'pipe' normally starts with a 'command', and then includes optional arguments or variables for/supporting that command.
The search command in the first line is the data selection step. It selects all the data matching the 'query' criteria. In this example, it selects all 20 records of the parsed demo dataset, where the @tags field contains fpl-example-data.
Roughly speaking, the operations returns a "stream object", with dimensions M x N, were M is number of records matching the criteria, and N is the number of "fields (keys)" in the largest object.
The let command in the second line is the data extraction step. Here, it is used in conjunction with the field-extraction function f(), to select "variables" or "columns" from the "stream object". The command returns a M x 6 'matrix' or 'table', where the six (6) columns are declared explicitly within.
FPL Result Table
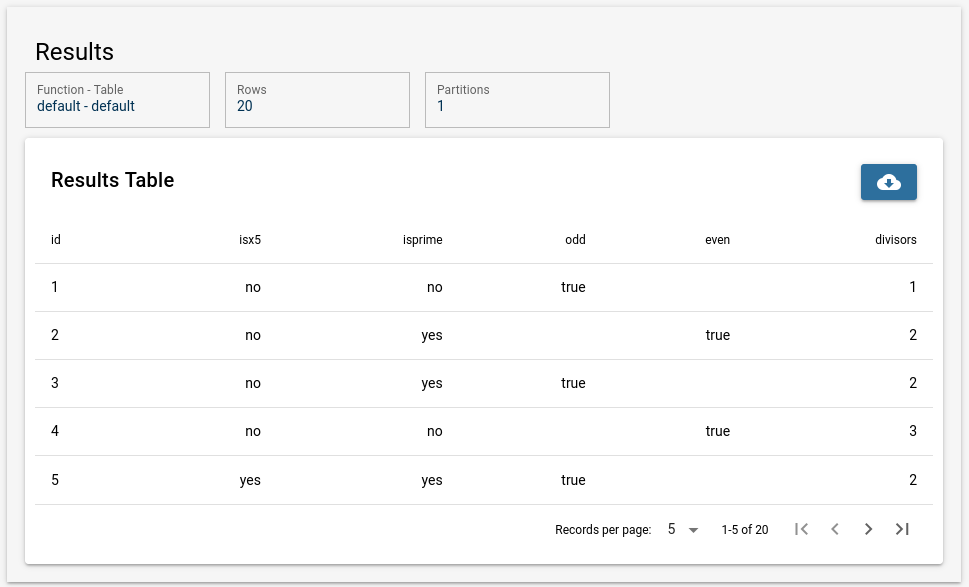
Running the example FPL task generates the following table, of size 20 x 6:

This produces a "table view" of the dataset, as a simple tranformation of the original set of JSON objects (for the selected fields). This table can also be downloaded as a CSV file.
Data Processing
The above showed a simple example of data extraction with FPL. However, the real power of the language is in data processing. We can add a few more commands to the FPL code block to get much more functionality.
Consider the following FPL task:
search sContent("@tags","fpl-example-data")
let {id, isx5, isprime, odd, even, divisors} = f("@fields")
aggregate v=values(id) by divisors
let num_of_ints = listcount(v)
Two additional lines were added to the first example above.
The aggregate command is a data processing command with several 'sub-functions'. In this example, the values() function was used. This function simply returns a 'set' containing the values specified by the argument (a particular 'column' defined by the previous let command). Finally, the by keyword allows 'grouping', by the values of another defined 'column'.
Taken as a whole, the entire line can be interpreted as: "Perform an aggregation of the values of column 'id' (ex. 1 - 20), over (by) the unique values of 'divisors' (ex. 1- 6). Take the resulting sets of values (ex. 6 sets), and store them as a new column 'v' in the resulting table."
Or in other words: place the numbers 1 thru 20 in groups defined by the number of factors of each.
The second let (extraction) command, used in conjunction with the listcount() function, calculates the size of each set in the 'v' column, and stores that results in a new column 'num_of_ints'. This action adds a third column (num_of_ints), to the two columns (divisors, v) from the aggregation command.
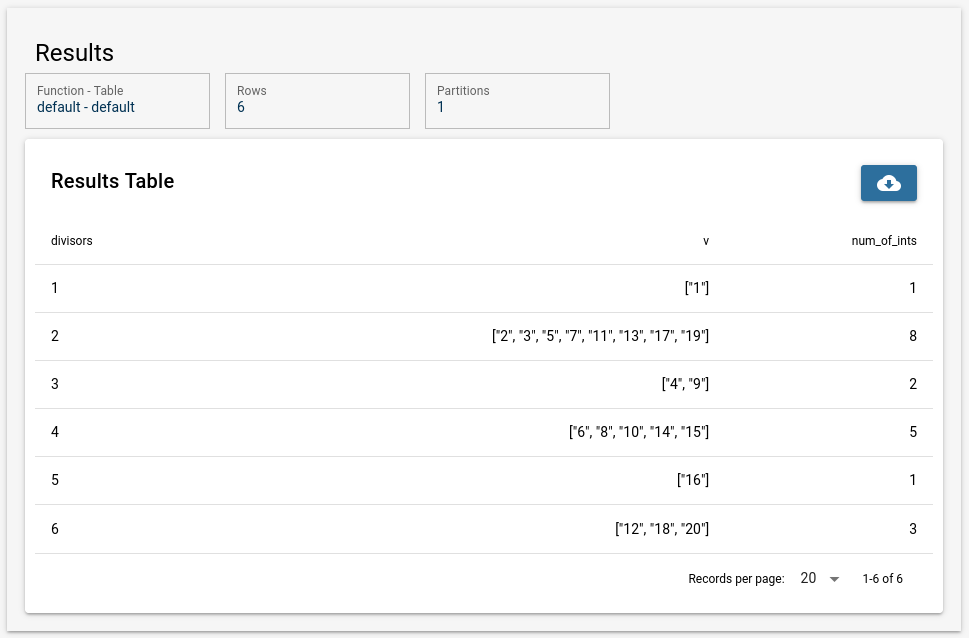
The following table, of size 6 x 3, shows the final result after the addtion of the aggregate and let commands:

The keen-eyed reader will observe here, that the expected result table after line 2 let {id, ix5... f("@fields") is removed and replaced with a new table after the aggregate command on line 3. This is an expected behavior for aggregation or aggregation-type function.
During the execution of an FPL, it is possible to generate one or more "intermediate" result tables. There are additional commands and function within FPL that will allow the user to use or export such tables. These commands will be explored later in the relevant sections of the documentation.
Summary
FPL is a functional programming language that is designed to work on streaming big data. The basic unit of FPL is the 'pipe', which can be organized into data selection, data extraction, and data processing categories. These different pipes then combine to make a 'stream', which then forms the FPL task.
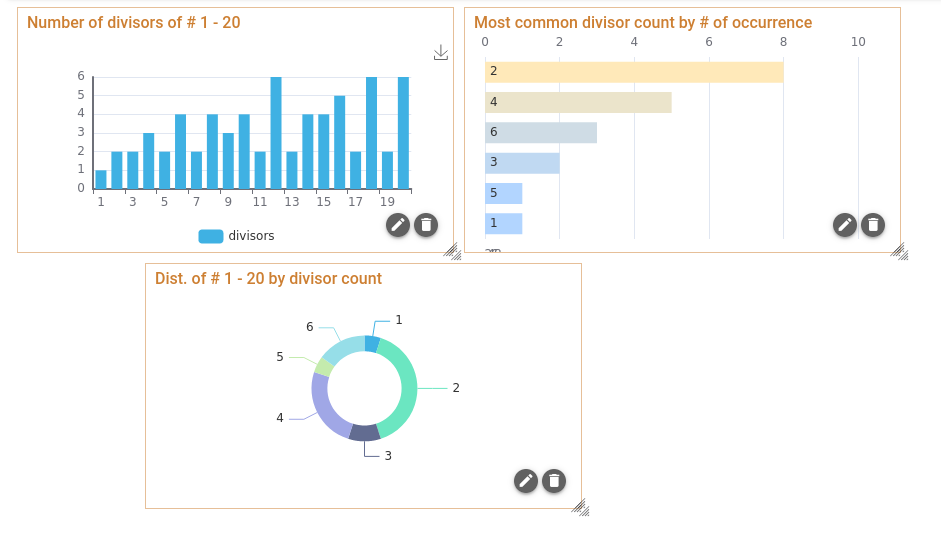
Running an FPL task produce one or more results tables. These tables can use used as-in, and exported as CSV files. Or they can be enhanced into graphical elements, such as Charts and Graphs, and even combined into published Reports.
Next-steps (Charts/Graphs and Reports)
After a task is run and the result tabled obtained, the next step in the FPL workflow is to present the results. The Fluency interface provides a means to produce and publish graphical reports using data tables from FPL tasks. Additionally, once published as a report, the FPL task can be schedule to run a regular intervals. The result of the most recent report execution will be shown as a Dashboard.

Please visit the relevant sub-section(s) for detailed information on configuring FPL Reports.
Page last updated: 2023 Apr 13